


Since its introduction 18 years ago in 2003, the Net Promoter Score, or NPS, has become a foundational business metric. Calculating a company’s NPS is a simple way to read customer sentiment and insights for businesses quickly. Many industries have widely embraced NPS as an indication of customer loyalty to the business.
The Net Promoter Score is a survey index ranging from -100 to 100 that measures the willingness of customers to recommend a company’s products or services to others. Customers are surveyed on a single question. They are asked the likelihood of recommending the company or brand to a friend or colleague on an 11-point scale. Based on their rating, customers are then classified into three categories: “promoters,” “passives,” and “detractors.”
- Promoters are customers who give a score of 9-10. They are very loyal to the company.
- Passives are customers who give a score of 7-8. They are moderate towards the company and may switch if a better option is given.
- Detractors are customers who give a score of 0-6. They are unhappy customers and are likely to badmouth the company if given an opportunity.
NPS is important. It gauges a customer’s overall satisfaction with a product or service and their loyalty to the brand. It is also used as a predictor of business growth. When your company’s NPS is high (or higher than the industry average), you know that you have a healthy relationship with customers who are likely to support the brand, fuel word of mouth, and generate a positive growth cycle.
So, what constitutes a good Net Promoter Score, and why? Comparing NPS results for your company versus your competitor can benefit your business through better customer experience knowledge. However, you first have to understand what a “good” NPS means.
What is a Good NPS Score?
Can you just come up with a “good” NPS figure? An NPS rule of thumb is that a score higher than 0 is considered good; higher than +50 is deemed to be excellent; more than 70, world-class. A more relevant comparison is your organization’s placement next to peer group benchmarks. Anything around or above average can be considered “good,” which helps you understand where you stand in the marketplace.
Some companies publicly advertise their NPS with shareholders as evidence of their company’s success. For instance, 1-800 Contacts, the original direct-to-consumer disruptor of the vision industry and today’s largest sellers of contact lenses, serves millions of loyal customers who have rewarded the brand with an NPS in the 80s.
If you choose to benchmark yourself against others, be aware that average scores vary widely across industries. Some industries provide less than excellent customer experiences, but they continue to thrive. The anomaly can happen when a company offers a critical service or has very little competition, such as utilities or cable providers.
If a benchmark for your industry doesn’t exist, benchmark against yourself. NPS isn’t just a score but a system to drive significant improvement in your products, services, and customer experience. This system helps you uncover and close the loop with unsatisfied or unhappy customers and address real-time issues.
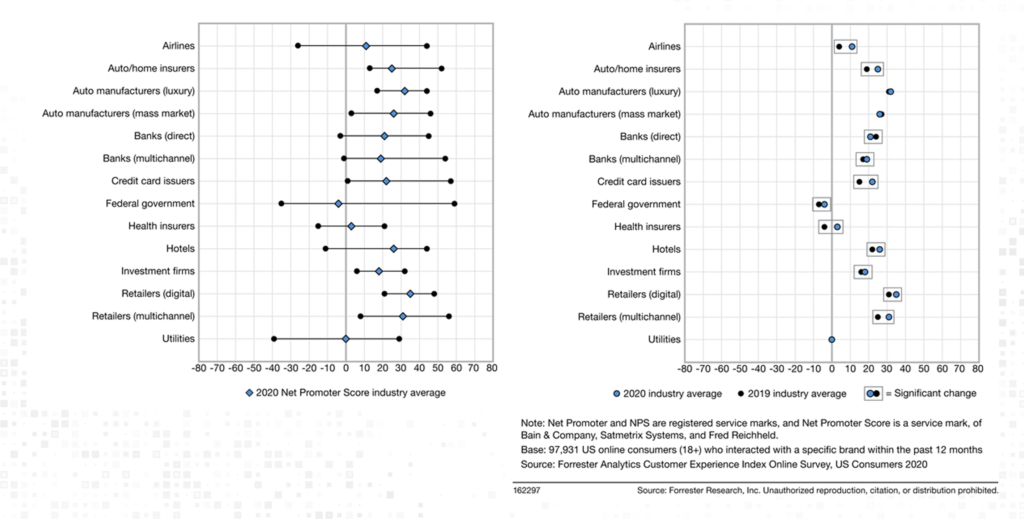
All of this means you can’t judge a company only by their NPS without considering their relative performance within the industry. Some businesses with an NPS of 30 might turn out to be the worst in the industry, and others may rank among market leaders. For example, customer experience in healthcare will have different benchmarks compared to customer experience in banking. Health insurance had an NPS average right around 3 in 2020, compared to an NPS average around 20 for direct and multichannel banks in 2020. (See a comprehensive list of Net Promoter Scores for 250 U.S. organizations across 14 industries in the Forrester report Net Promoter Benchmarks, 2020). These industries differ in many ways, and their customer satisfaction and insights are measured on multiple levels that may or may not be parallel with the sectors.
NPS in Most Industries is Advancing
Industries have been using their NPS to guide customer satisfaction for a significant period of time, so any increase or decline in NPS can be accurately analyzed. In Forrester’s 2020 NPS benchmark report referenced above, healthcare insurance was one of ten industries that saw a considerable positive shift from 2019 to 2020. “Health insurers increased NPS the most (by 7.5 points), which boosted the industry from negative NPS territory into single positive digits,” states the analyst research firm report. This rise was driven in part by a 10-plus-point increase by six health insurers, including the top three largest by membership: UnitedHealthcare, Anthem, and Aetna are the top three health insurance companies by membership.
NPS survey numbers can highlight the need for more robust handling of the customer experience. While it seems that not only are customers generally not as happy, they’re also not afraid to voice their opinion about what they want and need from companies with which they choose to do business. However, this is also an opportunity to take all of that customer feedback and bring a creative focus to retaining customers to remain loyal and help expand the business.
How to Calculate Your NPS
Getting answers to help calculate your NPS is about being fast and easy to implement. The single question asked to determine NPS—”On a scale of 0-10, how likely are you to recommend to a friend?”—can be accomplished in a variety of ways. If you want to ask in-the-moment feedback, an NPS survey can take the form of a pop-up notification or social media poll after a customer interacts with your company online. Or, you can collect survey results through an email follow-up survey, which can be launched and managed through an email survey service. The SundaySky Video Platform includes standardized survey questions for the viewer to give post-video feedback, and can be configured to ask the NPS question. Below is an example of an NPS survey question that accompanies a SundaySky video experience for the healthcare insurer Kaiser Permanente:
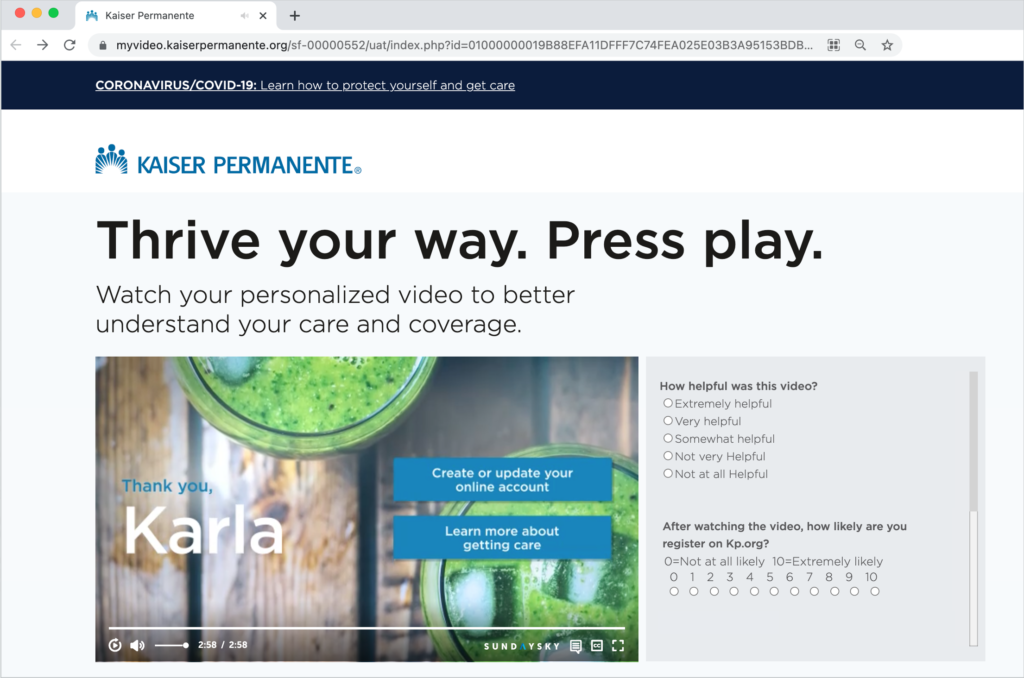
The NPS survey question can be slightly modified based on what you’re using it to measure: the company, brand, product, service, or even a digital tool at that moment (like a website, mobile app, or video). It’s customary and helpful to provide a blank field where customers can elaborate on why they gave the answer they did. Although open-ended feedback doesn’t impact the overall NPS, it provides an idea of areas of improvement to focus on to raise your overall score.
Answers to the NPS survey will result in numbers for detractors, passives, and promoters. Your NPS is the percentage of promoters minus the percentage of detractors. Here’s how to calculate the percentage:
- Enter all of the survey responses into a spreadsheet.
- Sort the responses by detractors, passives, and promoters.
- Add up the total responses from each group.
- To get the percentage, take the group total and divide it by the total number of survey responses.
- Now, subtract the percentage total of detractors from the percentage total of promoters—this is your NPS score.
Any NPS score below 0 indicates that a business has more detractors than promoters. Here’s where industry NPS benchmarks (like the ones mentioned above) are useful. While an NPS score of -3 may seem bad, it’s hard to interpret it without comparable scores from peers in your industry—if the industry average were -10, the score does not look as bad. However, a negative NPS is a sign that a business (or an industry overall) has work to do to improve the situation, reduce the number of unhappy customers, and generate more promoters.
Your NPS is a number you can compile and track regularly, not only for the whole company but for each product, store, customer service team, or digital experience. You can also track NPS for customer segments, geographic units, or functional groups. NPS helps everyone focus on the goals of creating more promoters and fewer detractors.
What Are Some Ways to Improve NPS?
Once you’ve calculated your NPS and run an analysis of the score, the next big question is: how do you use this information to serve your customers better and improve your Net Promoter Score? Here are a few simple ways you can begin to improve your NPS:
- Close the loop with customers: A company’s NPS encourages organizations to dig even deeper into the reasons behind their score with customers. You can use direct interviews, follow-up emails, etc., to collect feedback to focus efforts in a customer-centric direction. Start small by taking action whenever a detractor (0-6 rating) shows up. Have a manager or employee reach out to the customer, take their complaints seriously, and work to fix the situation (or, if you can’t, explain why it’s not happening).
- Use NPS feedback to train employees: The open-ended feedback from NPS surveys can point to areas where staff and departments can improve. Think of the feedback as a guide for customer satisfaction as well as employee engagement. This feedback can give you insight into how to train employees on improving the customer experience.
- A/B test new tactics and see what works: You don’t want to change your entire business model or product after a few complaints. However, if detractor data is pointing to a problem, it may be time to make changes. These changes may include trying new tactics to reach customers, such as experimenting with video. Tracking NPS and comparing the pre- and post-change scores and feedback determine the success of your changes.
- Use video to educate customers: Customer education is one of the most effective ways businesses can improve their customer experience. It’s critical to ensure customers are well-aware of the full value of the products and services they’ve purchased and the tools available to them. Video can be used throughout the customer journey at educational moments such as onboarding, when and how to self-serve, and to learn about new products or tools.
Here are some additional resources to explore on how to use video to increase NPS and to improve the customer experience:
- Learn how personalized video can increase NPS by 48+ points in SundaySky’s original research 2019 NPS Report: Improve Customer Experience & Drive Business Growth
- Spend 15-minutes with Forrester senior analyst Nick Barber on how to Embrace Video to Enhance Your Customer Experience